

We appreciate our readers’ patience as we defer our oil analysis by one more day and we are committed to publishing it tomorrow morning. That said, the situation is fairly clear at this stage: one of the most critical regions in the world for energy production — including natural gas, which should not be overlooked — is effectively in a state of full-scale war. Oil tankers have been struck off the coast of the Persian Gulf, and last night reports circulated that the Strait of Hormuz has apparently been declared closed by Iran. This development can only exert strong upward pressure on crude prices, which are already inherently volatile. For the record, yesterday WTI crude closed up 6.27%, Brent gained 6.68%, and this morning both benchmarks are advancing again by roughly 2%.
However, the move that struck us most on the first trading day of what is being referred to as the third Gulf war was elsewhere: while Asian indices fell sharply and the DAX — along with several of its European peers — dropped 2.56%, U.S. indices closed the session flat or positive. The S&P 500 finished up 0.04%, the Nasdaq gained 0.08%, and the Dow Jones Industrial Average rose 0.35%.
One might argue: why should Meta (+0.83%), Microsoft (+1.48%), or Nvidia (+2.99%) be materially affected by geopolitical tensions or rising oil prices? After all, the markets directly involved represent only a marginal share of their revenues. Moreover, the United States is energy independent — unlike Europe and China — and may in fact benefit from higher crude and LNG prices through increased exports.
However, markets are also driven by sentiment, and heightened uncertainty about the future typically exerts downward pressure on valuations. There are also more technical considerations: sharp moves in a large asset class — and the resulting losses for certain participants — can trigger forced liquidations in other positions as investors seek to meet margin calls.
Be that as it may, yesterday’s trading in U.S. indices appeared somewhat unusual, if not irrational. That said, markets can at times behave in ways that seem disconnected from underlying risks. This morning, futures are down approximately 0.7% on average.
TECHNICAL ANALYSIS
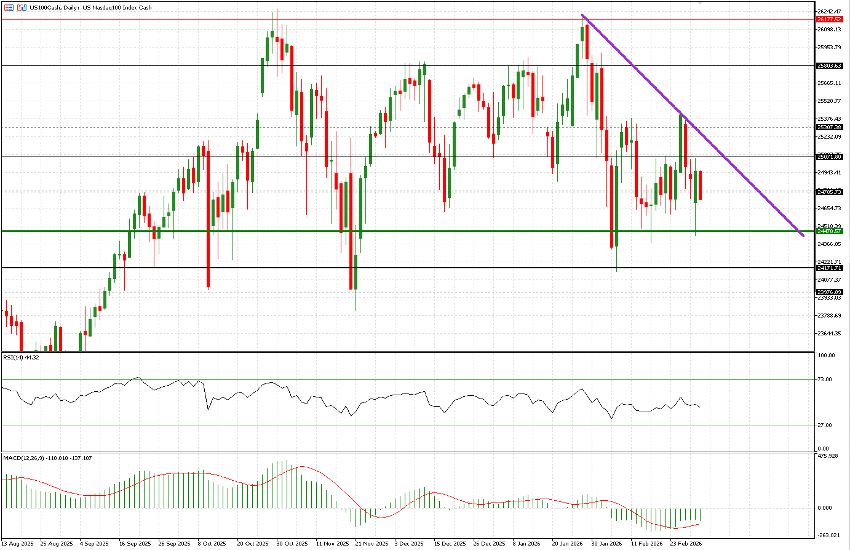
Let us begin with the US100. After opening below last Friday’s low at 24,700, the index declined to test 24,470 — an area that proved particularly significant between September and October, and again in mid-November. From there, a rebound carried prices close to 25,050, a level that had been tested multiple times from below in February before a mild pullback led to a close at 24,954. Although the index has been trading within a broad six-month range, it is now clearly positioned below a descending trendline.
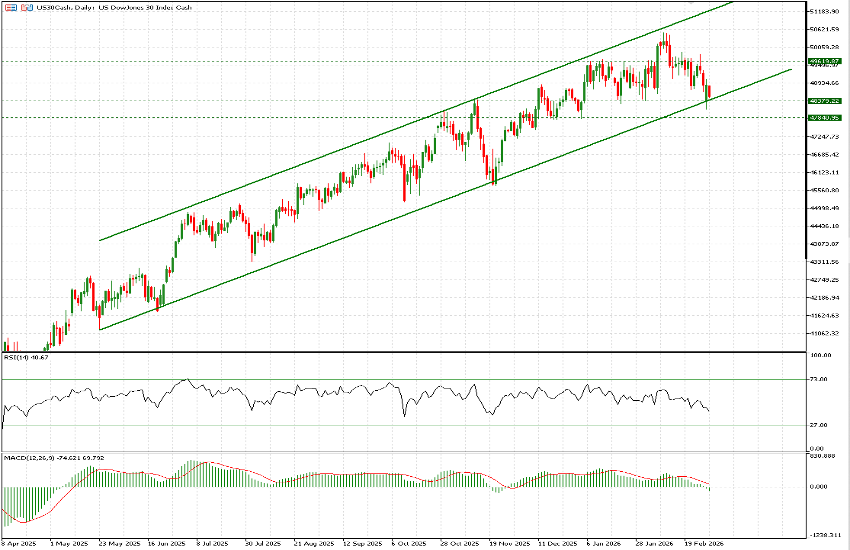
The US30 is particularly interesting, having been the strongest among the major U.S. indices in recent months. Yesterday’s opening occurred precisely on the ascending trendline in place since May 2025. The trendline was briefly broken to the downside, but buying interest emerged and prices rebounded cleanly from that level. This morning the index is down 0.72%, bringing it close to another test of that same trendline just 24 hours later.
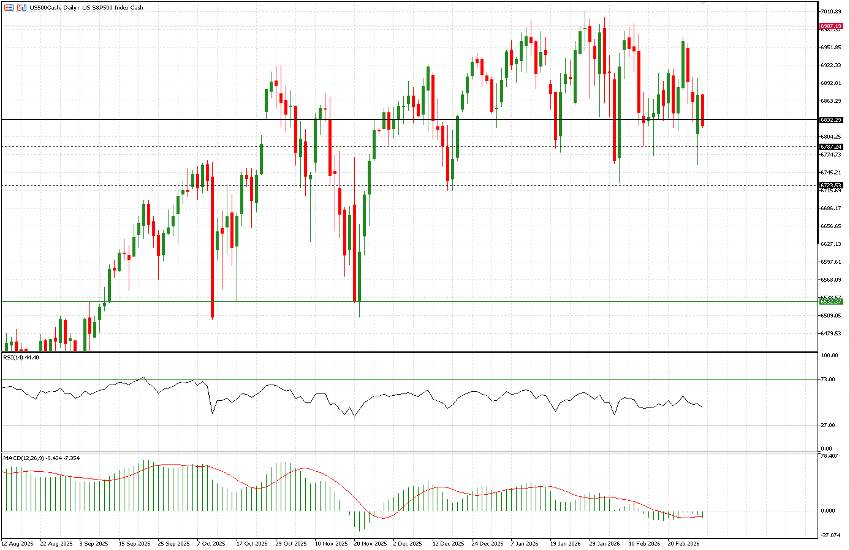
Finally, the US500: it has also been trading within a range for at least three months, with the 6,830 level acting as a key pivot throughout 2026. Yesterday’s opening occurred below that threshold, and the index fell beneath the year’s lowest closing level (6,758) before staging a $140 rebound to 6,899. This morning it is once again trading below 6,830, and 6,723 appears to be a level that is likely to be tested sooner rather than later.

")
Market Commentary 2026-04-28