

It has been a few days since we last discussed one of the hottest topics in the market and on everyone’s lips: the relentlessly rising price of gold. Yesterday, gold closed up 3.79%, reaching USD 4,959.
Gold is not the only commodity whose price chart is taking on a parabolic or near-vertical shape. In recent weeks, we have focused on silver, which—at a current price of $98.85—is just a step away from the psychological threshold of $100 and has already recorded a gain of +242% since the beginning of 2025. Natural gas has also posted an extraordinary move, rising from $3.02 to a peak of $5.65 in just four trading sessions, a gain of +82% (it is now retracing to around $4.69).
The underlying drivers differ across commodities. For natural gas, seasonality and weather conditions play a significant role. For silver, market participants are also pointing to potential export restrictions by China, following the inclusion of the metal on the U.S. list of commodities with high strategic value in November.
Gold is traditionally discussed in relation to the U.S. dollar and inflation, but these factors do not appear to be decisive in the current environment. In fact, speaking of a direct correlation with the U.S. dollar is not entirely accurate, as over the long term gold has shown a strong inverse correlation (close to 85%) with real interest rates. That relationship, however, has also broken down over the past couple of years. For the record, the 10-year real rate currently stands at 1.94% and is edging slightly higher. As for inflation, it is clearly decelerating across all major global economies.
This leaves central banks as the key factor. The substantial gold purchases that began at least as early as 2022, together with a diversification away from assets that historically represented a large share of reserves—namely U.S. Treasuries—appear to be the primary drivers of the move, amplified by a certain degree of market exuberance.
TECHNICAL ANALYSIS
The latest leg higher began on 31/12/2025 from a low of $4,277, meaning that over the past 20 days gold has appreciated by nearly $700. Unsurprisingly, technical indicators are strongly bullish, with the RSI clearly in overbought territory.
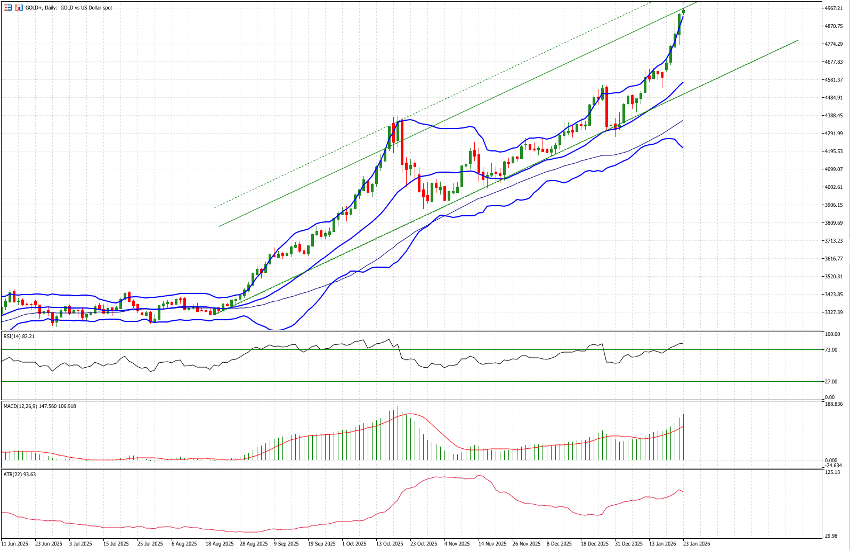
In phases of elevated volatility, we like to monitor Bollinger Bands—an effective tool for tracking volatility. On the one hand, the bands have widened significantly; on the other, the price is currently trading above the upper band. This configuration is typically associated with a pause and may foreshadow a consolidation or even a reversal, albeit potentially a modest one.
The ascending channel in which the security is trading suggests that the $5,000 area—also a key psychological level—could represent a near-term target. An extension toward the USD 5,090 zone also appears plausible. In any case, it is important to bear in mind that another measure of volatility, the ATR, currently indicates a daily trading range of approximately 2%, corresponding to $93.63.

")
Market Commentary 2026-04-28