

The USD—as represented by the USDIDX—has returned close to levels observed prior to the onset of the Middle East conflict. It is currently trading at 98.10, compared to a closing level of 97.60 on Friday, February 27, representing a difference of approximately 0.5%.
This remains significantly below the intraday high of 100.50 reached on March 31, implying a decline of approximately 2.44% (or $2.40) from peak levels.
All of this is occurring while the price of crude oil is approximately $32 higher (around 48%) compared to the end of February, and long-term interest rates (10-year US Treasuries) are at 4.283% versus 3.968% just over a month ago. Inflation has already shown signs of rising, financial conditions are tightening, and the cost of money has increased across the entire yield curve. The US 2-year yield has also risen by 39.3 basis points to 3.772%. The situation is similar in Europe, where the Bund has moved from 2.65% to 3.0675%.
Other asset classes have also outperformed the USD: the S&P 500 closed yesterday at 6,886.24, up 0.11% compared to February 27, indicating a full recovery of prior losses.
The FX market is highly liquid and structurally difficult to manipulate, as it is closely tied to real economic flows. It does not behave like smaller, speculative assets that can be influenced by a limited number of participants. As such, its signals should be interpreted with a high degree of relevance. The bond market—particularly interest rate markets—shares similar characteristics, although current signals between fixed income and FX appear to diverge.
Overall, the USD does not exhibit underlying strength, and the near-parity levels observed in EUR/USD at the beginning of 2025 are now distant (currently trading at 1.1765). The drivers behind this dynamic are complex and cannot be fully addressed here; however, two recent developments are worth highlighting.
The first, less significant, is Iran’s decision to impose a toll on tankers transiting through the Strait of Hormuz, payable in crypto or yuan. The second, more relevant and largely overlooked, is a recent statement by US Secretary of State Rubio, indicating that within 5–10 years it may become increasingly difficult to impose sanctions on foreign countries, as global payment systems continue to diversify beyond the USD and the SWIFT network.
TECHNICAL ANALYSIS
Starting with the weekly chart: in the spring of last year, the DXY (USDIDX) broke below the 100.35 level after more than three years—a threshold that had consistently acted as strong support. Following this break, prices declined gradually, reaching a low around 95.60.
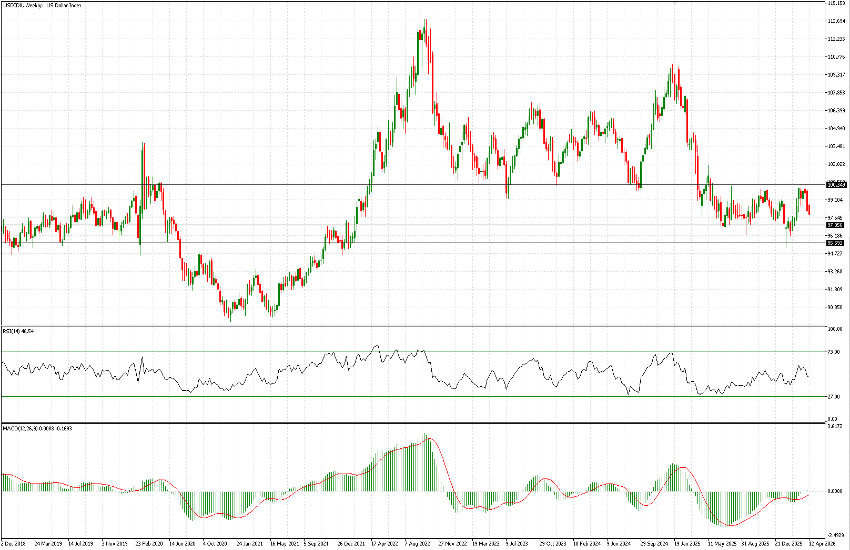
These levels define the broader range within which the index traded between summer 2018 and summer 2019, and they continue to frame price action over the past year. The recent high at 100.325, reached approximately 10 sessions ago, marked the beginning of the current retracement.
On the shorter-term daily chart, the USDIDX broke its short-term upward trend line and the support level around 99.18 on the day the ceasefire was announced, leaving a downside gap. At current levels, price is approaching the weaker support area around 97.85.
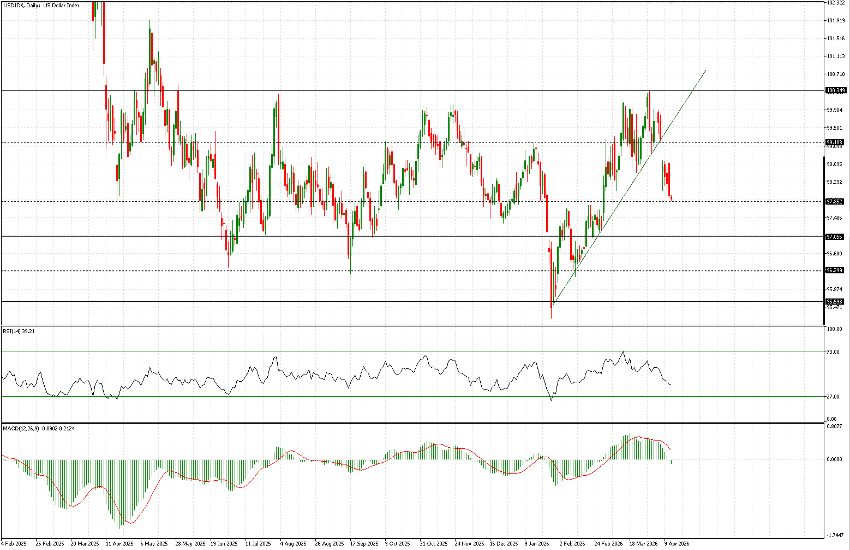
From a technical perspective, the base case suggests continued downside in the medium term, with a potential test of 97.05. A temporary consolidation or rebound at current levels remains possible. Over a broader horizon, the prevailing scenario remains a continuation of the longer-term range, with a potential extension toward 96.30 in the coming weeks.

")
Market Commentary 2026-04-28