

It is important to understand that more than 150 different blends of crude oil are produced worldwide, and their production costs can vary significantly. Some are more desirable and easier to refine than others (requiring less processing) and are classified according to their weight (light vs. heavy) and their acidity (sulfur content).
Estimated extraction costs range from about $5 per barrel in countries such as Saudi Arabia and Iraq, up to nearly $80 per barrel for processing Canadian oil sands. In between lies shale oil extracted through fracking—a true revolution in the U.S. market in recent years—whose cost has now fallen to around $45–$50 per barrel. It follows that when the market price drops below the production cost of particularly expensive sources, it becomes uneconomical to continue extracting them.
WTI Crude and Brent Crude are the two most heavily traded futures contracts on the international market and the ones accessible to retail traders. WTI Crude is the benchmark for onshore U.S. oil, while Brent represents offshore oil from the North Sea. Although North Sea production is now almost negligible, Brent remains the global benchmark for pricing physical oil transactions between physical traders.
Effectively, these two futures do not represent the specific oil blends in question. Rather, another benchmark—whose importance has grown significantly in recent years and which is central to trade flows toward Asia—would be more relevant: the Dubai Crude future. In any case, its recent price increase has broadly followed the same trajectory as the other benchmarks, rising by approximately 13% this week.
More than 20 million barrels of oil pass daily through the Strait of Hormuz, and about 80% of that volume is destined for Asia. Similarly, roughly one-fifth of global natural gas traffic transits through the strait, with Qatar having become a key supplier to Europe before recently suspending production.
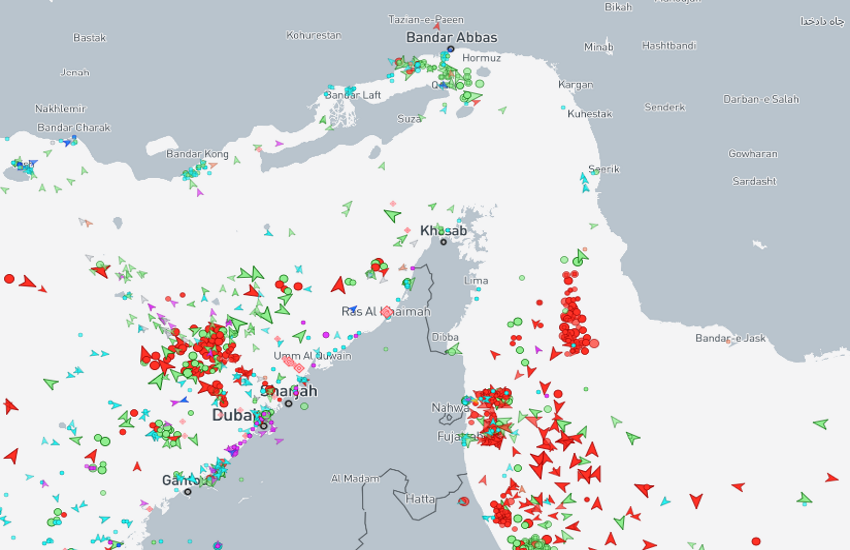
At present, shipping traffic in the area has been blocked for several days, and as radar images show, tankers are parked on both sides of the strait. The issue is not only the risk of military attack: tankers must be insured in order to operate, and Lloyd’s of London—which has effectively held a centuries-long dominance in shipping reinsurance—has stopped issuing new policies this week and, in some cases, has even suspended those already issued.
This is a highly interesting topic that deserves deeper analysis. It also explains yesterday’s remarks by Donald Trump, who stated that the United States would now step in to provide such reinsurance coverage. The operational details remain unclear, but the stated objective is to help restore the smooth flow of maritime traffic.
TECHNICAL ANALYSIS
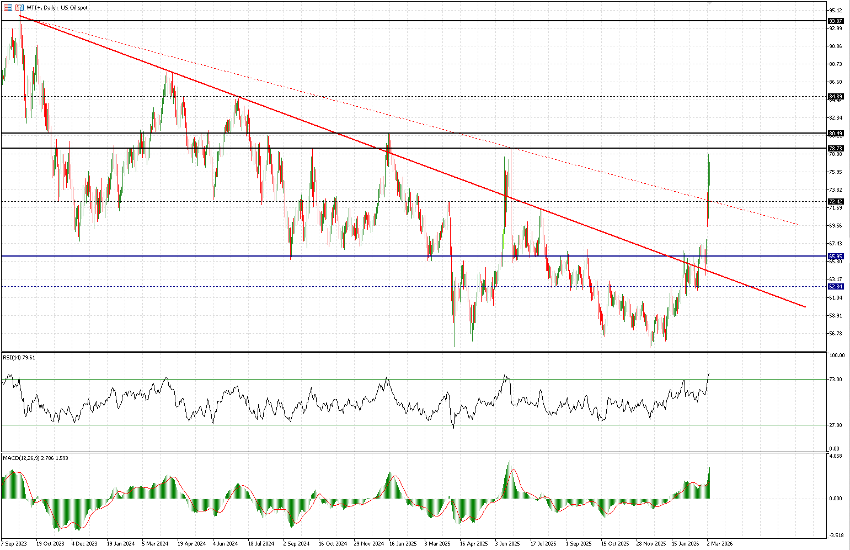
Those who have followed us in recent weeks will know that we had been closely monitoring WTI (Crude), particularly the descending trendline that originated in September 2024 and, above all, the $66 level. This was both because tensions were rising in the Gulf region and because, from a technical standpoint, the futures contract was showing signs of recovery and moving toward the $66 area. That level had previously been a key support, tested multiple times since at least 2021, and was only broken at the beginning of last year.
Over the previous two weeks, the downtrend line was broken and then retested. The $66 level was challenged, and last week’s close—following a strong bullish candle (insiders?)—was at $67.30. This week opened with a gap up, and the contract is currently posting a weekly gain of 13.88%.
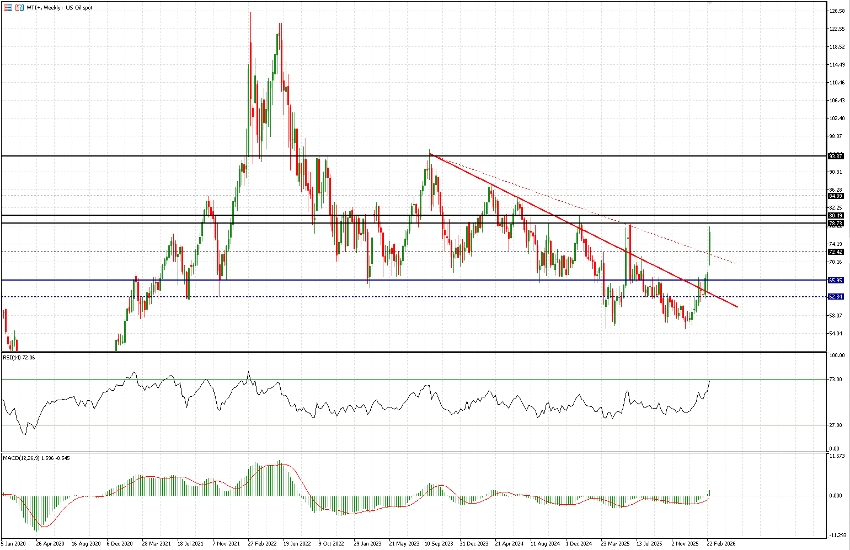
Chasing price is generally a poor strategy, even in situations where seemingly clear news flow dominates the market. The $78.75–$80.50 area represents fairly strong resistance, and the RSI is now in overbought territory (although too much weight should not be placed on that alone). Of course, an immediate further breakout is possible, which could quickly push prices toward $85; and in a wartime scenario, we would not even rule out $94. However, we believe a pause is likely for now—perhaps even a short technical correction toward $72.50.

")
Market Commentary 2026-04-28